Go Performance Debugging: A Practical Guide to pprof, Traces, and the GC
Go makes it easy to write fast code. It also makes it easy to write code that’s slow for reasons you’ll never spot by reading it. The tooling to find out why ships with the language and is safe to run in production. Most teams barely touch it.
Here’s the workflow I follow when a Go service is slower than it should be, roughly in the order the steps tend to pay off.
Step 0: decide what “slow” means
Pin down the symptom first, because it decides which tool you open:
| Symptom | Start with |
|---|---|
| High CPU usage | CPU profile |
| Memory growing, or frequent GC | Heap profile (alloc_space and inuse_space) |
| Latency is high but CPU is low | Block / mutex profile, execution trace |
| Goroutine count keeps climbing | Goroutine profile |
| p99 spikes, p50 fine | Execution trace, GC trace, CPU throttling |
Skip this and you can easily lose a day optimizing a function that was never the problem.
Turn on pprof
Expose the profiling endpoints on an internal port, never on your public listener.
import (
	"net/http"
	_ "net/http/pprof"
)

func main() {
	go func() {
		// internal only: bind to localhost or an admin port behind your network policy
		log.Println(http.ListenAndServe("localhost:6060", nil))
	}()
	// ...
}
The CPU profiler samples about 100 times a second with low overhead, so running it against production traffic is reasonable. That matters. Plenty of performance problems only show up under real load.
CPU profiles: where the time goes
Grab 30 seconds of CPU profile and open it in the web UI:
go tool pprof -http=:8080 http://localhost:6060/debug/pprof/profile?seconds=30
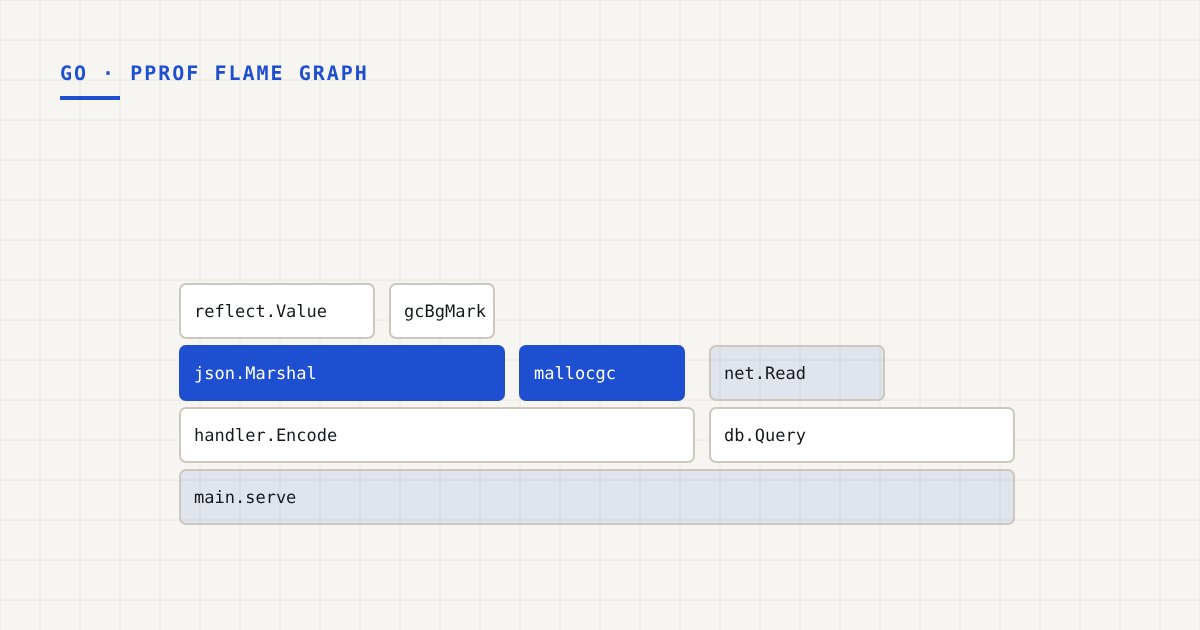
Go straight to the flame graph. Width is time, so look for wide frames. A few patterns keep coming up:
runtime.mallocgcandruntime.gcBgMarkWorkerare wide. You’re allocating too much. CPU spent here is the cost of memory churn, so switch to the heap profile next.encoding/jsondominates. Reflection-based JSON is slow. Decode into concrete types, avoidmap[string]any, and consider a code-generated encoder for the hottest paths.syscallorruntime.futexis wide. Lots of small writes or lock contention. Batch the writes, or check the mutex profile.- Your logging library shows up. More often than anyone admits.
In the top view, sort by flat to see which functions burn CPU themselves, and by cum to see which call paths are expensive overall.
Heap profiles: allocations, not just leaks
The heap profile has two views. You want both.
# what's live right now (leaks, big caches)
go tool pprof -sample_index=inuse_space http://localhost:6060/debug/pprof/heap

# everything allocated since start (GC pressure)
go tool pprof -sample_index=alloc_space http://localhost:6060/debug/pprof/heap
inuse_space answers “why is memory high?” alloc_space answers “why is the GC busy?” A service can have a tiny live heap and still spend 30% of its CPU on GC because it allocates gigabytes per minute in short-lived garbage.
Once you know where it comes from, the usual fixes:
- Preallocate slices and maps when you know the size:
make([]T, 0, n). - Reuse buffers with
sync.Poolfor hot, short-lived objects. Measure first; pools add complexity. - Avoid converting between
[]byteandstringin loops. - Check what escapes to the heap with
go build -gcflags=-m. A value that escapes because you took its address or put it in an interface costs an allocation.
Block and mutex profiles: when CPU is low and things are still slow
Low CPU with high latency usually means goroutines are waiting on something. These two profiles tell you what. They’re off by default because they cost a little, so turn them on deliberately:
runtime.SetBlockProfileRate(10_000)     // ~1 sample per 10µs spent blocked
runtime.SetMutexProfileFraction(100)    // sample 1 in 100 contention events
The block profile shows where goroutines wait on channels, select, and sync primitives. The mutex profile shows which locks are contended and who’s holding them.
The classic finding is one global sync.Mutex around a cache or a metrics map. Shard the lock, switch to sync.RWMutex for read-heavy data, or use atomics.
Goroutine profiles: leaks
curl -s http://localhost:6060/debug/pprof/goroutine?debug=1 | head -50
This groups goroutines by identical stack, with a count. 40,000 goroutines parked on the same chan send, or stuck in a network read with no deadline? That’s your leak. The cause is nearly always a missing context cancellation, a missing timeout, or a channel nobody reads anymore.
The execution tracer: for latency you can’t explain
Profiles aggregate. Sometimes you need a timeline instead: what was each goroutine doing during that one 200ms request?
curl -o trace.out http://localhost:6060/debug/pprof/trace?seconds=5
go tool trace trace.out
The trace shows goroutine scheduling, GC phases, syscalls, and network blocking per processor. Reach for it when p99 is bad and the profiles look normal. Typical things you’ll spot: GC stop-the-world or mark assist lining up with the latency spikes; goroutines that are runnable but not running, meaning too few processors (too much work, or a wrong GOMAXPROCS); or one goroutine doing serial work that everything else waits on.
Traces are heavy. Capture seconds, not minutes.
GC tuning: GOGC and GOMEMLIMIT
Watch the GC directly with:
GODEBUG=gctrace=1 ./your-service
Each line shows heap sizes before and after collection and how long the phases took. There are two knobs:
GOGC(default 100) controls how much the heap can grow before the next collection. Higher means fewer GCs and more memory.GOMEMLIMIT(Go 1.19+) sets a soft memory limit. The GC works harder as you approach it.
For containers, a common setup is GOMEMLIMIT at about 80 to 90 percent of the container’s memory limit, with GOGC left at default or raised. The GC runs rarely while memory is plentiful and only gets aggressive when it has to, which helps avoid OOM kills.
Still, tuning is the last resort. Cutting allocations almost always beats turning knobs.
GOMAXPROCS and CPU limits
Before Go 1.25, GOMAXPROCS defaulted to the number of CPUs on the node, not the container’s CPU limit. A pod limited to 2 CPUs on a 64-core node would run 64 Ps, and the Linux CFS quota would throttle it hard. The standard fix was go.uber.org/automaxprocs.
Go 1.25 made the default container-aware, so recent versions respect the cgroup CPU limit. On an older toolchain, check this first. The symptom is random-looking latency spikes with no obvious cause. The same throttling dynamics hurt Node services too, which I wrote about in event loop lag and CPU throttling.
Benchmarks to lock in the fix
Once you know the hot function, write a benchmark so you’re measuring changes, not guessing:
func BenchmarkEncode(b *testing.B) {
	ev := sampleEvent()
	b.ReportAllocs()
	for b.Loop() {
		_, _ = encode(ev)
	}
}
go test -bench=Encode -benchmem -count=10 > old.txt
# make your change
go test -bench=Encode -benchmem -count=10 > new.txt
benchstat old.txt new.txt
benchstat tells you whether the difference is real or noise. Don’t skip -count. Single runs lie.
Last, consider profile-guided optimization. Drop a representative production CPU profile into your main package as default.pgo and the compiler uses it for better inlining decisions. Small, free, and worth doing once the obvious problems are fixed.
Takeaways
- Start from the symptom. CPU, memory, waiting, and tail latency each have their own tool.
alloc_spaceexplains GC pressure;inuse_spaceexplains memory size.- Low CPU plus high latency means waiting. Use block and mutex profiles and the tracer.
- Set
GOMEMLIMITin containers, and make sureGOMAXPROCSmatches your CPU limit. - Prove every fix with a benchmark and
benchstat.