Node.js Event Loop Internals: What Actually Runs When
“Node is single-threaded” is one of those statements that’s true enough to repeat and wrong enough to cause outages. Your JavaScript runs on one thread. Node itself doesn’t. Knowing where that line sits is the difference between a service that handles 10k concurrent connections calmly and one that falls over the first time someone uploads a big JSON file.
So here’s what the loop actually does, in order, followed by the mistakes that block it.
The pieces
V8 runs your JavaScript and owns the call stack and the heap. libuv, the C library underneath Node, owns the event loop. It talks to the OS for non-blocking network I/O (epoll on Linux, kqueue on macOS, IOCP on Windows) and runs a small thread pool for work the OS can’t do asynchronously. Node’s own bindings glue the two together and add their own queues for process.nextTick and promise microtasks.
Network sockets don’t use the thread pool. Make 5,000 outbound HTTP calls and there still aren’t 5,000 threads anywhere. The OS tells libuv when sockets are readable or writable, and libuv calls back into JavaScript.
The phases of one loop iteration
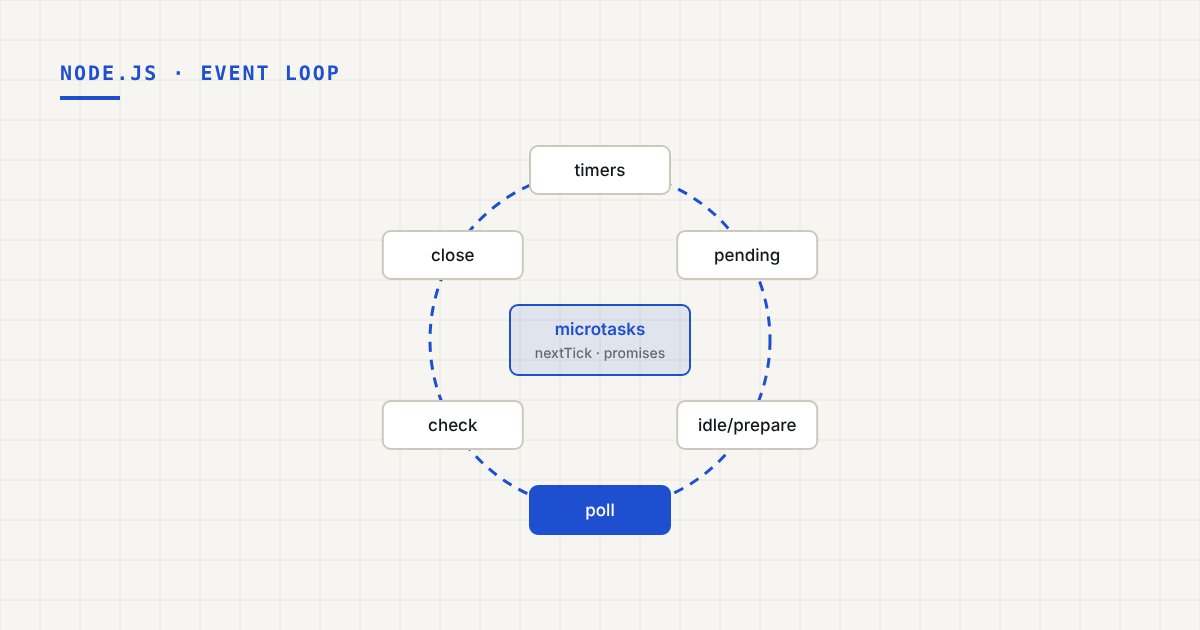
Each turn of the loop walks through a fixed set of phases, each with its own queue of callbacks:
- Timers. Runs callbacks from
setTimeoutandsetIntervalwhose time has come. A timer’s delay is a minimum, not a promise. - Pending callbacks. Some I/O callbacks deferred from the previous iteration, like certain TCP errors.
- Idle / prepare. Internal housekeeping.
- Poll. Where most of the work happens. libuv asks the OS for I/O events and runs their callbacks: incoming requests, data on sockets, completed file reads. If there’s nothing else to do, the loop waits here for I/O, up to the time the next timer is due.
- Check. Runs
setImmediatecallbacks. - Close callbacks. Things like
socket.on('close').
Then it goes round again. Once there are no active handles or requests left (no servers listening, no timers, no pending I/O), the process exits.
Microtasks and process.nextTick
Notice that promises aren’t in the phase list. That trips up a lot of people. Promise callbacks and process.nextTick callbacks aren’t phases at all. They’re drained after every single callback the loop runs, before it moves to the next one.
The order is:
- The
process.nextTickqueue, fully drained. - The promise microtask queue, fully drained.
- Repeat if either queue got new items.
setTimeout(() => console.log('timeout'), 0);
setImmediate(() => console.log('immediate'));
Promise.resolve().then(() => console.log('promise'));
process.nextTick(() => console.log('nextTick'));
console.log('sync');
This prints sync, nextTick, promise, and then timeout and immediate. Those last two can swap when run from the main module, depending on whether the 1ms minimum timer has elapsed by the time the loop starts. Inside an I/O callback, setImmediate always runs first, since the check phase comes right after poll.
Here’s the practical danger. Microtasks drain completely before the loop moves on, so a recursive chain of process.nextTick or promise callbacks can starve I/O entirely. The loop never gets to the poll phase and no new requests are read. setImmediate doesn’t have this problem because it yields back to the loop.
The thread pool, and why it’s only 4 threads
Some work can’t be done with non-blocking OS APIs, so libuv hands it to a thread pool. The pool has 4 threads by default (UV_THREADPOOL_SIZE, which can be raised up to 1024). It’s used by:
- Most of
fs(file reads and writes) dns.lookup, which is whathttp.getuses by default to resolve hostnames- Async
cryptolikepbkdf2,scrypt, andrandomBytes zlibcompression
Four is small, and the pool is shared. If your service hashes passwords with scrypt and resolves hostnames with dns.lookup, a burst of logins can queue DNS lookups behind password hashing. Outbound HTTP calls look slow, the network is fine, and you lose an afternoon. They were waiting for a pool thread.
If you lean on these APIs, set UV_THREADPOOL_SIZE explicitly, as an environment variable before the process starts. Also, dns.resolve* uses c-ares and doesn’t touch the pool; dns.lookup does.
What actually blocks the loop
All of this is fine as long as each callback is quick. The loop is cooperative. While one callback runs, nothing else does: no timers fire, no sockets get read, no health checks answer. The usual offenders:
JSON.parse/JSON.stringifyon big payloads. Parsing a 50 MB body is pure synchronous CPU.- Sync APIs.
fs.readFileSync,crypto.pbkdf2Sync,zlib.gzipSync. Fine at startup, a problem inside a request handler. - Catastrophic regex backtracking. A badly written regex against user input can take seconds. This is a known DoS vector, often called ReDoS.
- Big loops over in-memory data. Sorting or transforming 500k records in one go.
- Heavy logging. Synchronous serialization of large log objects on every request adds up fast.
Fixes: stream instead of buffering, move CPU-heavy work to worker_threads, chunk long loops with setImmediate in between, and cap request body sizes.
How to know if it’s happening
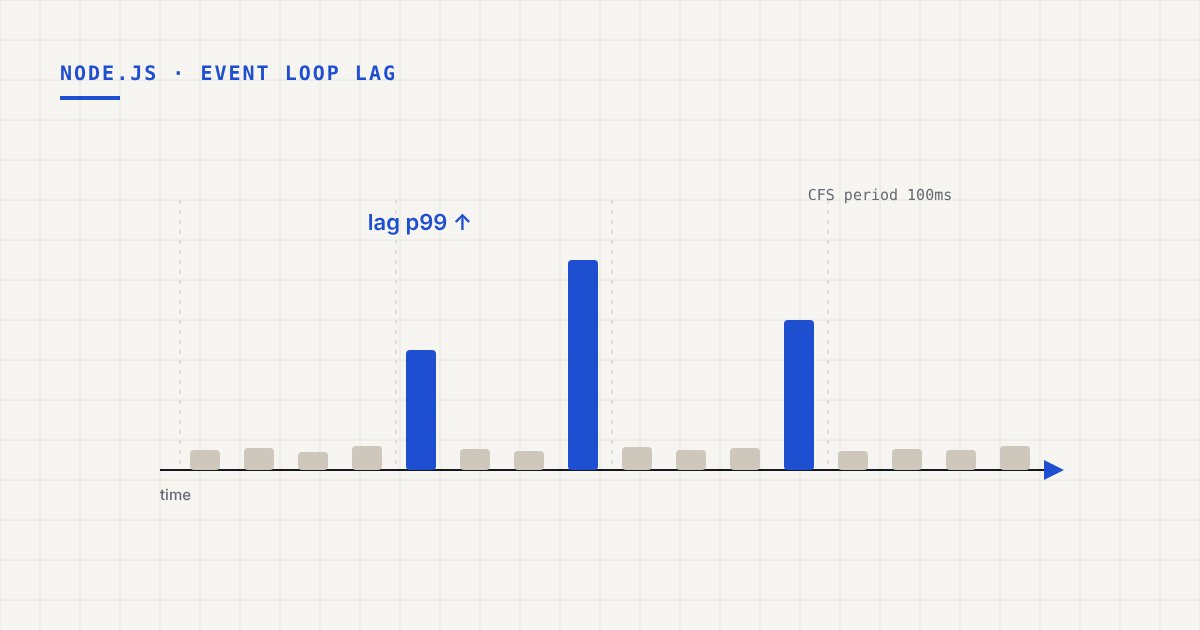
Request latency alone won’t tell you the loop is blocked. Slow requests could be slow downstreams, slow DNS, or a saturated pool. You need a direct measure of how long the loop takes to come back around. That’s event loop lag (or event loop delay), and it’s one of the most useful signals a Node service can export.
Measuring it, reading it, and how it interacts with Kubernetes CPU limits are all in the follow-up: Event loop lag as a performance signal.