Event Loop Lag in Node.js: Using It to Debug Performance and CPU Throttling
A slow Node.js service sends most people straight to request latency and downstream calls. Reasonable, but it misses the most common Node-specific failure, which is the event loop itself falling behind. When that happens every request in the process slows down at once, including the ones that do nothing expensive.
Event loop lag catches it. It’s cheap to collect and easy to read once you know the patterns. It’s also the best tool I know for spotting something dashboards usually hide: CPU throttling in containers.
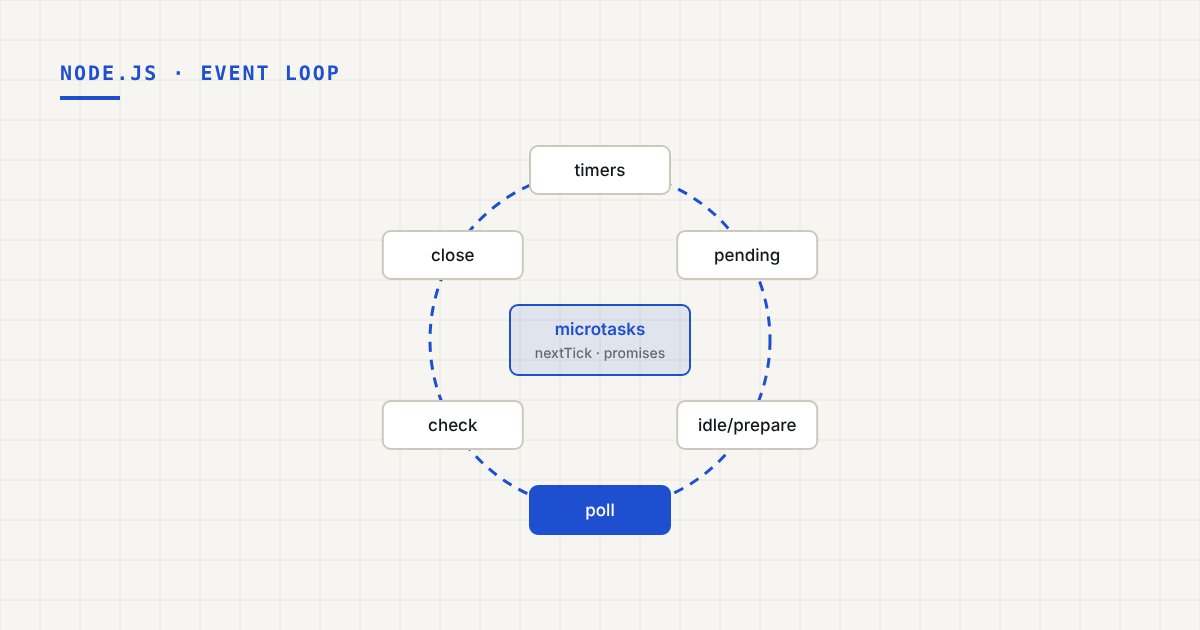
(Need a refresher on the loop itself? Start with Node.js event loop internals.)
What event loop lag measures
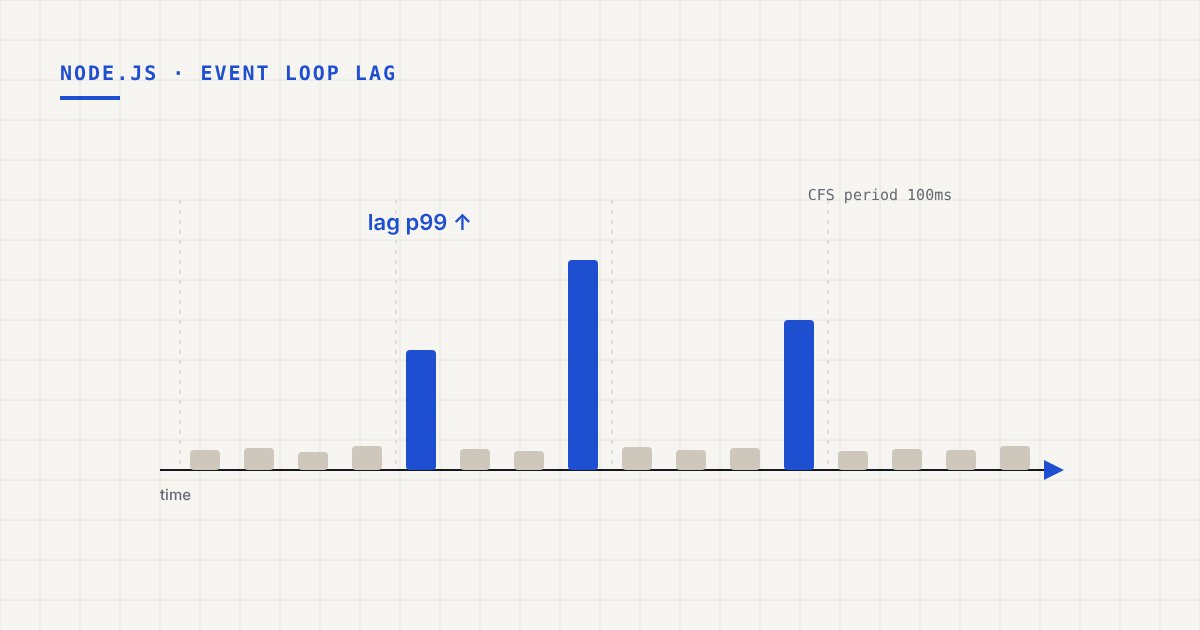
Schedule a timer for 10ms and measure when it actually fires. At 10ms, the loop was free. At 250ms, something kept the loop busy (or kept the process off the CPU) for about 240ms, and no other callback in the process could run during that window.
So lag is how long a ready-to-run callback has to wait: the queueing delay every request pays on top of its own work.
Measuring it properly
Don’t hand-roll the setTimeout trick. Node ships a histogram-based monitor in perf_hooks that samples at a fixed resolution and gives you percentiles:
const { monitorEventLoopDelay, performance } = require('node:perf_hooks');

const lag = monitorEventLoopDelay({ resolution: 10 });
lag.enable();

let lastELU = performance.eventLoopUtilization();

setInterval(() => {
  const now = performance.eventLoopUtilization();
  const elu = performance.eventLoopUtilization(now, lastELU); // delta since last tick
  lastELU = now;

  metrics.gauge('eventloop_lag_p99_ms', lag.percentile(99) / 1e6);
  metrics.gauge('eventloop_lag_max_ms', lag.max / 1e6);
  metrics.gauge('eventloop_utilization', elu.utilization);

  lag.reset();
}, 10_000).unref();
The histogram reports nanoseconds, hence the division. And watch p99 and max, not the mean. A loop that’s fine 99% of the time and stalls for 400ms every few seconds has a lovely mean and a terrible user experience.
On prom-client, collectDefaultMetrics() already exports nodejs_eventloop_lag_p99_seconds and friends. You may have this data already and just not be looking at it.
Its partner metric: event loop utilization
Lag tells you that the loop was delayed. Event loop utilization (ELU) tells you how much of the time the loop was busy running your code versus idle, waiting for I/O. It’s a number between 0 and 1.
The two together are where it gets useful:
| Lag | ELU | Most likely cause |
|---|---|---|
| Low | Low | Healthy. Slowness is elsewhere (downstreams, DB, network). |
| High | High (near 1) | CPU-bound JavaScript. Your code is doing too much on the main thread. |
| High, in spikes | Moderate | Long synchronous tasks (big JSON.parse, sync I/O) or GC pauses. |
| High, in regular spikes | Low to moderate, CPU below its limit | Check CPU throttling. |
Most teams miss that last row.
CPU throttling: the slowdown your CPU graph hides
On Kubernetes, a CPU limit is enforced by the Linux CFS bandwidth controller, which works in periods (100ms by default). A limit of 500m means 50ms of CPU time per 100ms period. Use that up and every thread in the container is paused until the next period starts.
Two things make this nasty for Node.
- Usage is averaged, throttling isn’t. The dashboard says the pod averages 300m against a 500m limit. Looks fine. But CPU usage is bursty. A request arrives, the process burns 50ms of CPU in 30ms of wall time, and then it’s frozen for the remaining 70ms of the period. The average never shows it.
- Node isn’t really one thread. V8 runs garbage collection on helper threads, and the libuv pool can run four tasks in parallel. All of those draw from the same quota. A GC cycle plus a couple of
zlibcalls can drain a small quota in a few milliseconds of wall time.
To the event loop, a throttle looks exactly like a long synchronous task. The timer fires late. That’s what makes lag such a good detector. The typical pattern is lag spikes clustered at tens of milliseconds, up to roughly the CFS period, while CPU usage looks comfortably under the limit.
Confirming it
Don’t stop at the lag pattern. Check the kernel’s counters. Inside the container, on cgroup v2:
cat /sys/fs/cgroup/cpu.stat
# usage_usec      ...
# nr_periods      120345
# nr_throttled    18211
# throttled_usec  912004113
More than a few percent for nr_throttled / nr_periods means you’re being throttled regularly. With cAdvisor metrics in Prometheus, the same ratio is:
sum by (pod) (rate(container_cpu_cfs_throttled_periods_total{container="api"}[5m]))
/
sum by (pod) (rate(container_cpu_cfs_periods_total{container="api"}[5m]))
Put that next to eventloop_lag_p99 and the correlation is usually obvious.
Fixing it
- Raise the limit or remove it. Plenty of teams keep CPU requests (for scheduling) and drop CPU limits on latency-sensitive services. Whether that suits you depends on how much you trust your neighbors on the node. I’d at least test it.
- Don’t size limits from average usage. Size them from peak usage over short windows.
- Reduce parallel CPU bursts. Bigger heaps can mean fewer GC cycles. Moving heavy compression or hashing out of the hot path helps too.
- Don’t just add pods with the same small limit. If ELU is low and you’re still throttled, the issue is short bursts hitting the quota, not total capacity. More pods lowers average load per pod, but each one can still burst into its limit. Fix the limit first, then scale out if the work is genuinely CPU-bound.
When it’s not throttling
High lag with high ELU means real CPU work on the main thread. Go find it:
node --cpu-prof app.jswrites a.cpuprofileyou can open in Chrome DevTools.- In production, take a short profile through the inspector, or use a continuous profiler if you have one.
- Look for wide frames in
JSON.parse, regex execution, template rendering, or your own loops.
If lag spikes line up with garbage collection, confirm with --trace-gc or a PerformanceObserver on 'gc' entries. The root cause is usually a heavy allocation rate, and heap profiles show where it comes from.
Using lag to protect the service
Once you trust the metric, you can act on it live:
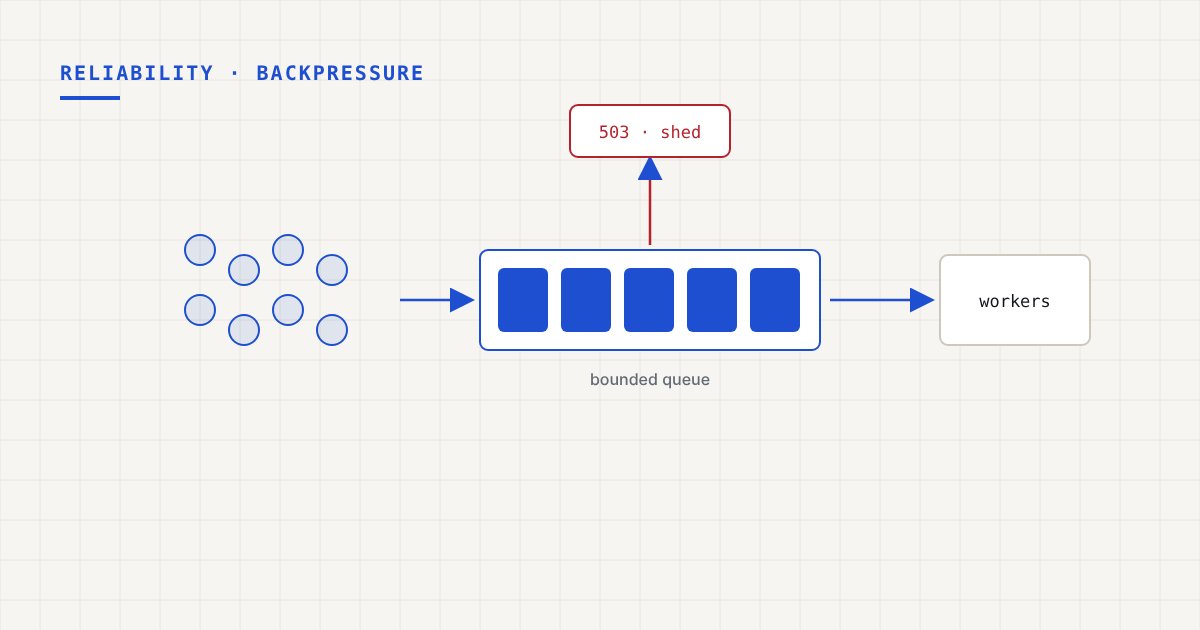
- Load shedding. When lag p99 crosses a threshold, return
503to new requests instead of accepting work you can’t serve on time. For Fastify,@fastify/under-pressuredoes exactly this with amaxEventLoopDelaysetting. - Readiness, not liveness. Failing readiness on high lag takes the pod out of rotation while it recovers. Failing liveness restarts it, throwing away a warm process and pushing its traffic onto the others. That usually makes things worse.
- Alerting. Alert on sustained lag p99, not single spikes.
Rejecting work early gets its own post: backpressure and load shedding.
If you add one metric to your Node services this week, make it lag p99 next to ELU. Together they tell you whether to look at your code, your GC, or your CPU limit before you’ve opened a profiler.