Reading PostgreSQL EXPLAIN ANALYZE: A Backend Engineer's Guide to Slow Queries
Most slow API endpoints I’ve looked at weren’t slow because of application code. They were slow because of one query, and that query was slow because Postgres picked a plan nobody expected. EXPLAIN ANALYZE shows you that plan. Reading it well is one of the most useful skills a backend engineer can pick up.
Always use ANALYZE and BUFFERS
Plain EXPLAIN shows what Postgres plans to do. EXPLAIN ANALYZE runs the query and shows what actually happened. Add BUFFERS to see how much data it touched:
EXPLAIN (ANALYZE, BUFFERS)
SELECT id, total
FROM orders
WHERE customer_id = 4821 AND status = 'paid'
ORDER BY created_at DESC
LIMIT 20;
Careful: ANALYZE really executes the statement. For UPDATE or DELETE, wrap it in a transaction and roll back:
BEGIN;
EXPLAIN (ANALYZE, BUFFERS) UPDATE orders SET status = 'void' WHERE ...;
ROLLBACK;
How to read a plan
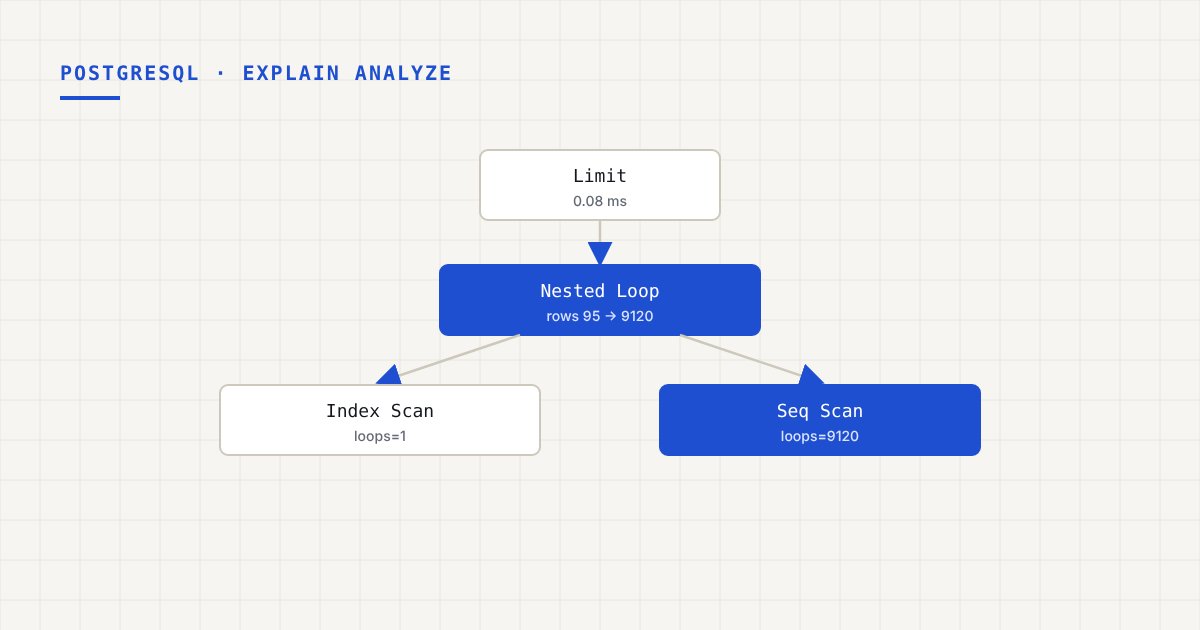
A plan is a tree. Execution starts at the most indented nodes and flows up. Each node looks something like this:
Index Scan using orders_customer_id_idx on orders
  (cost=0.43..812.20 rows=95 width=16)
  (actual time=0.041..38.512 rows=9120 loops=1)
  Filter: (status = 'paid'::text)
  Rows Removed by Filter: 41388
  Buffers: shared hit=1204 read=3310
What I look at, in order:
actual time. The second number is the node’s total time in milliseconds. Find the node where time jumps. That’s your problem.- Estimated vs actual
rows. Here Postgres expected 95 rows and got 9,120. When estimates are off by 10x or more, the planner is working from bad information, and the plan built on top is often wrong. loops. Time and rows are per loop. A node showing 0.5ms withloops=20000actually cost 10 seconds. This one catches everybody at least once.Rows Removed by Filter. The index found rows, then Postgres threw most of them away. Usually the index doesn’t match the query.Buffers.shared hitcame from Postgres’s cache;readcame from disk or the OS cache. Lots ofreadon a hot query means the working set doesn’t fit in memory, or the query touches far more data than it needs.
The common scan types
- Seq Scan: reads the whole table. Fine for small tables, or when the query returns a big fraction of rows. A problem on a large table when you want a handful.
- Index Scan: walks the index, then fetches each matching row from the table.
- Index Only Scan: answers entirely from the index, without visiting the table. Very fast, but only if the visibility map is up to date, which depends on vacuum.
- Bitmap Heap Scan: collects matching row locations from one or more indexes first, then reads the table in physical order. Good for medium-sized result sets.
And the join types:
- Nested Loop: for each row on one side, look up matches on the other. Great when the outer side is small and the inner lookup is indexed. Terrible when the outer side turns out to be huge, which is exactly what bad estimates lead to.
- Hash Join: build a hash table from one side, probe with the other. Good for large unsorted inputs.
- Merge Join: walk two sorted inputs together.
Fixing the example: a better index
In the plan above, Postgres used an index on customer_id, filtered out 41,388 rows by status, and then had to sort what was left by created_at. One composite index that matches the query fixes all of it:
CREATE INDEX CONCURRENTLY orders_customer_status_created_idx
  ON orders (customer_id, status, created_at DESC);
Column order matters. Equality columns go first (customer_id, status), then the column you sort or range-scan on (created_at). Postgres can now jump straight to the matching rows, already in order, and stop after 20. The sort node disappears.
If the query only needs a couple of extra columns, an INCLUDE clause can turn it into an index-only scan:
CREATE INDEX CONCURRENTLY orders_customer_status_created_idx
  ON orders (customer_id, status, created_at DESC) INCLUDE (total);
On production tables, always use CONCURRENTLY. A plain CREATE INDEX blocks writes for the whole build.
When estimates are wrong
Most surprising plans trace back to bad row estimates. Usual causes:
Stale statistics. After a big load or delete, run
ANALYZE orders;. Autovacuum gets there eventually, but “eventually” can be too late.Correlated columns. Postgres assumes columns are independent by default. If
city = 'Pune'andstate = 'MH'always go together, it’ll underestimate the combination badly. Extended statistics fix this:CREATE STATISTICS orders_city_state (dependencies) ON city, state FROM orders; ANALYZE orders;Skewed data. If one value is extremely common, increase the statistics target for that column so Postgres samples it better:
ALTER TABLE orders ALTER COLUMN status SET STATISTICS 1000;.
Patterns I keep seeing
- Functions on indexed columns.
WHERE lower(email) = $1can’t use a plain index onemail. Create an expression index onlower(email), or store the normalized value. OFFSETpagination on deep pages.OFFSET 100000still reads and discards 100,000 rows. Switch to keyset pagination:WHERE created_at < $last_seen ORDER BY created_at DESC LIMIT 20.- Type mismatches. Comparing a
bigintcolumn to anumericparameter (easy to do by accident from some drivers and ORMs) casts the column, and the index on it can’t be used. The plan will show the cast in the filter. ORacross different columns.WHERE a = $1 OR b = $2often turns into a seq scan. AUNIONof two indexed queries can be much faster.- N+1 queries from the ORM. No single query looks slow, but there are 300 per request.
pg_stat_statementsshows the same query with a huge call count.
Find the queries worth fixing
Don’t optimize queries at random. Turn on pg_stat_statements and sort by total time, not just mean time:
SELECT query, calls, total_exec_time, mean_exec_time, rows
FROM pg_stat_statements
ORDER BY total_exec_time DESC
LIMIT 10;
A 2ms query called 50 million times a day costs far more than a 3-second report that runs once an hour. To catch slow plans in production as they happen, auto_explain can log the plan for any query slower than a threshold.
Takeaways
- Use
EXPLAIN (ANALYZE, BUFFERS). PlainEXPLAINonly shows guesses. - Find the node where time jumps, compare estimated to actual rows, and remember both are per loop.
- Composite indexes: equality columns first, then sort or range columns. Build them
CONCURRENTLY. - Fix estimates with
ANALYZE, extended statistics, and higher statistics targets. - Pick what to fix from
pg_stat_statements, by total cost.